-
Example 1
First we embed a screenshot as an
imgso that a static version exists if interactivity fails. Next we create aTimeSeriesJavascript object with someVega JSONand then initialise it with the container of theimgelement. TheTimeSeriesthen replaces the contents of the container with an interactive version.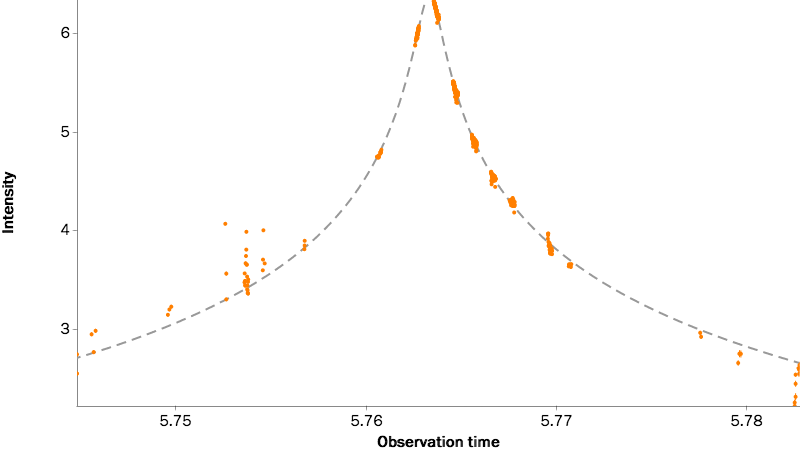
This plot represents observations of a gravitational microlensing event. Orange points show data from the Danish 1.54m telescope. The dashed line shows a model of the event. The timeseries is created from inline JSON. -
Example 2
The same as Example 1 but we load the data from external CSV files.
This plot represents observations of a gravitational microlensing event. Orange points show data from the Danish 1.54m telescope. The dashed line shows a model of the event. The timeseries is created from inline JSON. -
Example 3
This example behaves in a similar way to the one above except that we load the
Vega JSONfrom a separate file. Thefit:trueattribute tellsTimeSeriesto use the existing size of the element in the HTML; over-riding the size specified in theJSONfile.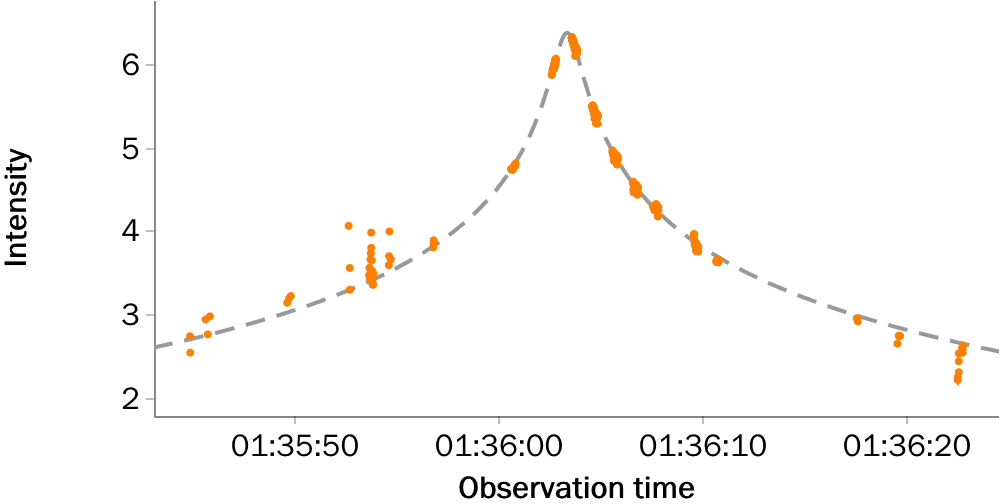
An example using JSON loaded from a file -
Example 4
This example is identical to the one above except that the container has a size specified in CSS and we inherit that using the
fit:trueoption rather than use the width and height set in theJSON.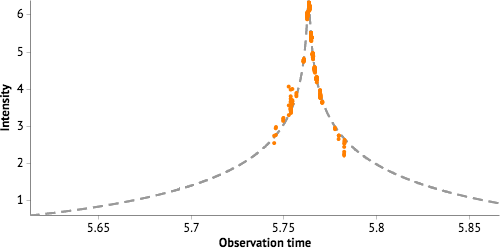
An example using JSON loaded from a file -
Example 5
This example shows the same timeseries as the previous example but it is non-interactive by default. We add a CSS class to it and a Javascript event so that the end-user can choose to initialize it. This can help reduce the amount of processing done on page load if there are multiple timeseries on the page.
An example using JSON loaded from a file -
Example 6
A more complicated example with multiple series all in different
CSVfiles.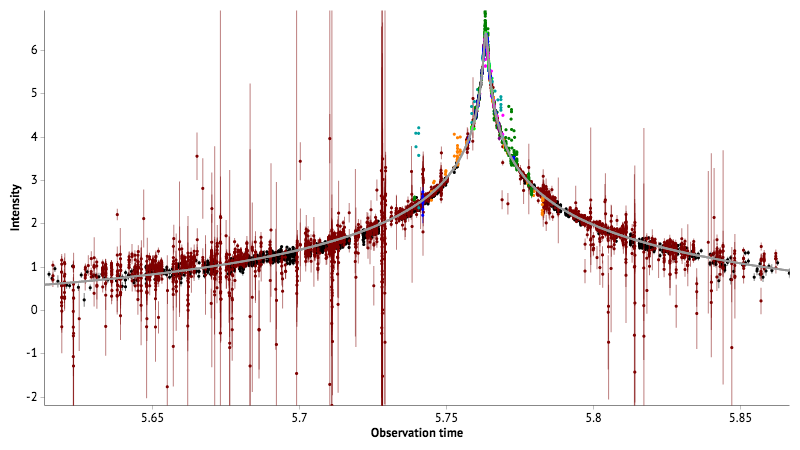
This plot represents observations of a gravitational microlensing event. Each data series shows the variation in brightness of the target star as measured by different telescopes in the ROBONET collaboration. -
Example 7
This example uses a different dataset. Once again we delay loading so start with a static image. This time we use the
mouseoverevent to prompt interaction. In this example we style the tooltips using a CSS class (aas-theme) provided in the Javascript set-up.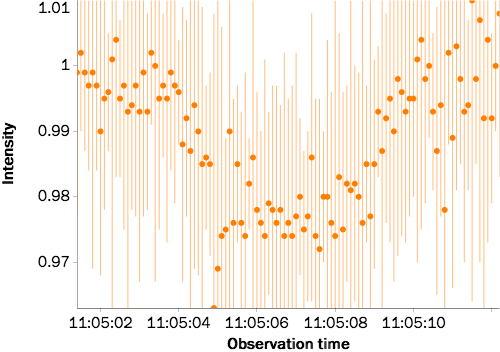
An example using JSON loaded from a file