Fork Me on GitHub
Interactive time series figures in AAS journals
Basic example
Last updated:
2019
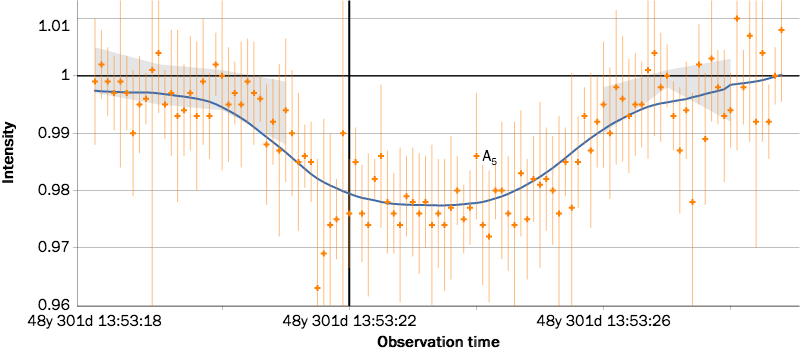
This plot represents a simulated lightcurve.