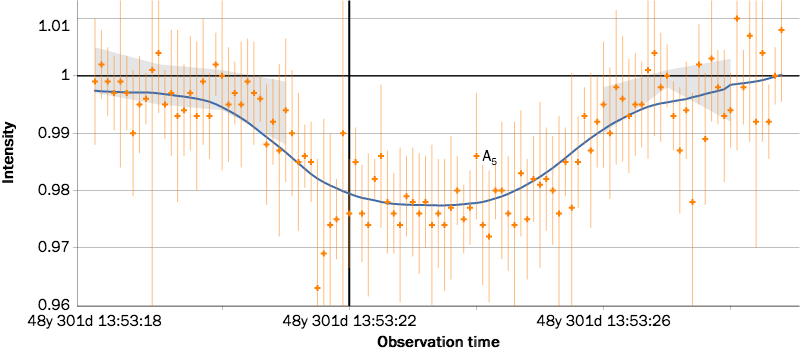
The timeseries.js package is being developed as part of a project between AAS Publishing and the Astropy Project. The goal of this project is to provide astronomers with all the tools needed to make it possible for astronomers to read in and manipulate time series in Astropy, produce interactive figures, and easily embed these in a paper.
This part of the project is the Javascript library for creating the interactive figures. We are also developing the astropy-timeseries python package which provides classes to represent time series as well as tools to read these in from files and to manipulate the time series directly from python.
The packages are still in development, but it is already possible to try out some of the functionality. If you run into any issues or would like to request features, please head over to our issue tracker for the Javascript library or the issue tracker for the python library.
